
Together with our higher education and employer partners, we’re proving what’s possible when you empower the next generation of leaders with the skills, networks, confidence, and experience necessary to launch a strong career.
To date, we have worked with more than 15,5001 Fellows across the country, and our momentum continues to build. By 2032, we aim to serve 80,000-100,000 students, serving 25,000 new students each year through the Braven course.
In this report, we spotlight the stories of the exceptional undergraduate students we are privileged to serve and examine Braven’s impact through two central questions:
Are our Fellows securing quality career outcomes that put them on the path to the American Dream?
Are we supporting Fellows on the path to internships and college completion?

Only about one quarter of the low-income or first-generation college students who enroll in college each year will graduate and secure a strong first job or enter graduate school.2
That’s about one million students every single year who aren’t on the path to the American Dream.

In collaboration with our higher education and employer partners, Braven empowers promising college students with the skills, networks, confidence, and experience necessary to transition from college to strong economic opportunities, which lead to meaningful careers and lives of impact.
The next generation of leaders will emerge from everywhere.

Braven provides career readiness for students earning a four-year degree, ensuring students graduate ready to secure a strong first opportunity.
The Braven Equation is the sum of four career-readiness factors—skills, networks, confidence, and experience—which add up to a career-ready college graduate.

Braven equips promising college students on their paths toward quality economic opportunities through a semester-long, cohort-based course—developed with input from our higher education partners and faculty, employer partners, volunteers, and students—and support that extends beyond the course, continuing through six months after college graduation.
In our core higher education model, students take the course for credit. Students who come through BravenX via college success organizations receive a financial stipend in lieu of credit.

The entry-level market is tight. We have seen stagnation in entry-level job openings which, in part, is driving rising unemployment of recent graduates.
Compared to high school graduates, bachelor’s degree holders have higher employment rates, greater job security, and earn more over their lifetime.
According to The American Job Quality Study, employees with a bachelor’s or graduate degree are more likely to have strong job quality than those with an associate’s degree, some college, or a high school education or less.5
Workers with a four-year degree earn 70% more than workers with a high school diploma alone.
The challenge today is not the value of the degree itself, but ensuring students can successfully translate the skills they develop in college into the skills needed in entry-level positions.
AI is making it easier to apply to jobs. In June 2025, LinkedIn reported that the number of job applications surged more than 45% year-over-year, and the platform is clocking an average of 11,000 applications per minute.7
Twenty-six percent of candidates say AI has made it harder to stand out due to increased competition. Among Gen Z, that number jumps to 45%.7
Employers are prioritizing human skill competencies to distinguish the strongest entry-level candidates in an increasingly competitive applicant pool.
These include:8
These are closely aligned with the six career-readiness skills Braven helps students develop in the Accelerator course:


This new class is outpacing their peers nationally in quality outcome attainment12 by 12 percentage points (57%13 vs 45%14) within six months of graduation.
This year across our core model higher education partner sites, quality opportunity attainment ranged from 41% to 69%. As we scale, we will continue to learn from and address these differences to ensure that Fellows remain on the path to economic mobility.
We are proud of the achievements of our graduates who hail from various institutions and are launching their careers into local labor markets that vary in industry composition and varied economic strength.
Of the 1,306 Braven Fellows who graduated from college in 2025,
are employed or enrolled in graduate school
secured quality
or pathway outcomes

2025 BRAVEN GRADUATES
How we define quality economic opportunities:


Enrollment in graduate school is one of the ways Braven defines a quality outcome.
of the 2025 graduates went on to graduate school within six months of graduation.16


A high quality first job helps individuals build long-term wealth and health. Braven defines a strong first job as one that requires a bachelor’s degree and is full-time, and also includes some combination of promotion pathways, employee benefits, and a market-competitive starting salary.
Six months post-graduation, Braven Fellows in the class of 2025 of our core higher education partners are out earning the national average salary for early college graduates.


RECENT BRAVEN GRADUATES

ARE IN ROLES ALIGNED WITH THEIR LONG-TERM CAREER INTEREST 20

HAVE A JOB WITH EMPLOYER PROVIDED BENEFITS 20
Nationally, 63% of Pell Grant recipients come from families with annual incomes below $30,000, and 85% come from families earning less than $50,000 annually. 21
In their first job out of college, Braven Fellows nationwide are individually outearning most families who receive the Pell Grant.


Most Popular Industries for Braven Fellows Nationally
Education
BANKING AND FINANCE
HEALTH
NONPROFIT
RETAIL

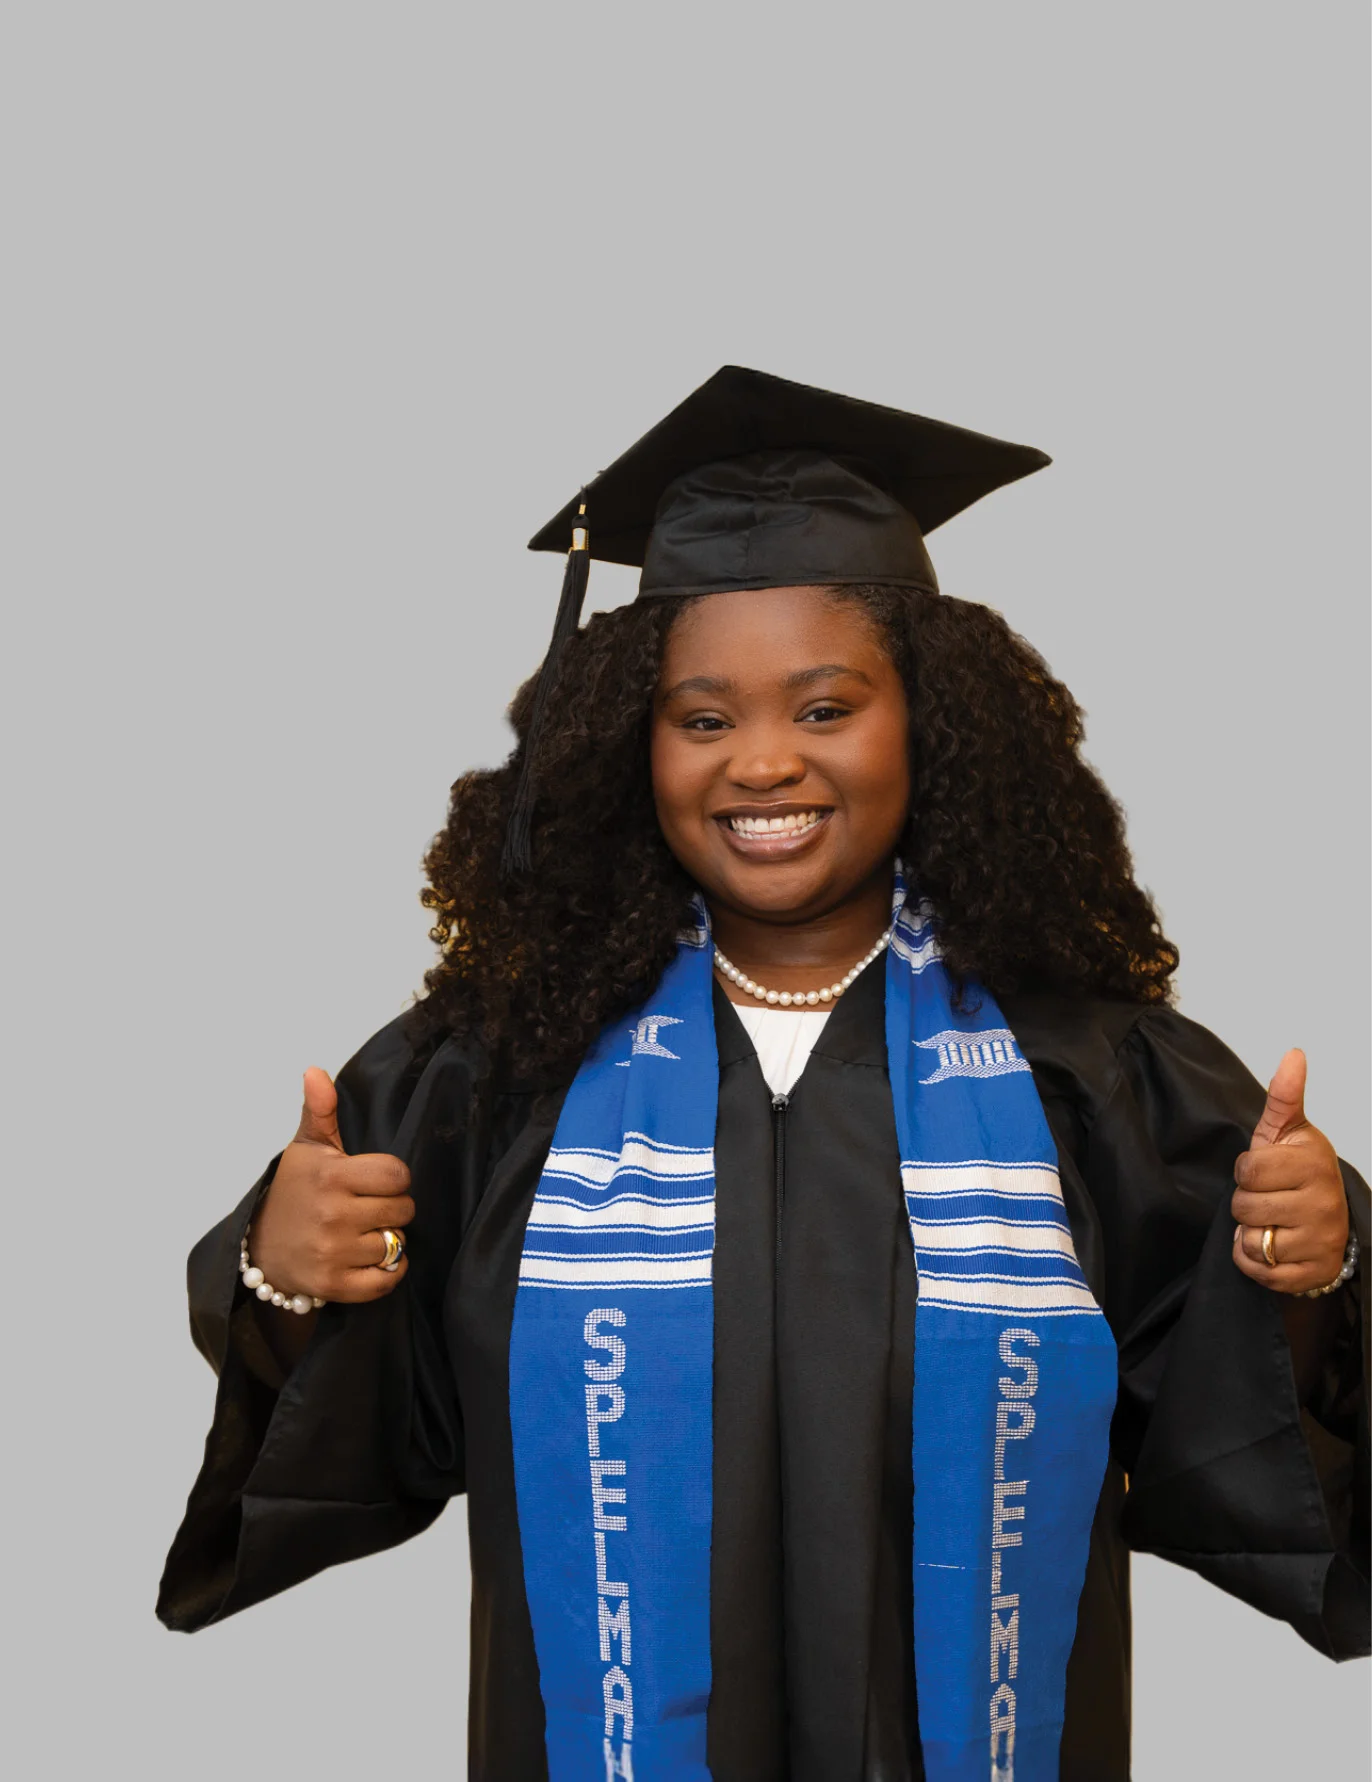
With Braven’s help, Infinite Clovie built the foundation to get on the path to the American Dream.

Internships help students chart their futures, but fewer opportunities and rising competition make them harder to secure.


Internship demand is outpacing availability.
Internship postings declined more than 15% between January 2023 and January 2025. Meanwhile, internship applications surged.
The National Survey of Work-Based Learning from Strada Education Foundation and the Center for College Workforce Transitions found that paid internships have positive career value in several domains including social capital and mentorship.
To what extent do you think your experience expanded your professional network?


To what extent did your supervisor provide mentorship to support your career goals?
For college students, internships serve as critical proof points of experience that open professional doors.
Compared with graduates nationally, Braven 2025 graduates were 28 percentage points more likely to have at least one internship during their college experience.


.webp)

Nationally, less than 7 in 10 students graduate within six years of college enrollment.26
Braven Fellows, who typically join us during their sophomore or junior year, are graduating at encouraging rates.
Braven Fellows achieved
a 92% six-year on-time
graduation rate 27
Higher Education Partners & Employer Partners
Chicago State University (BravenX)
The City College of New York
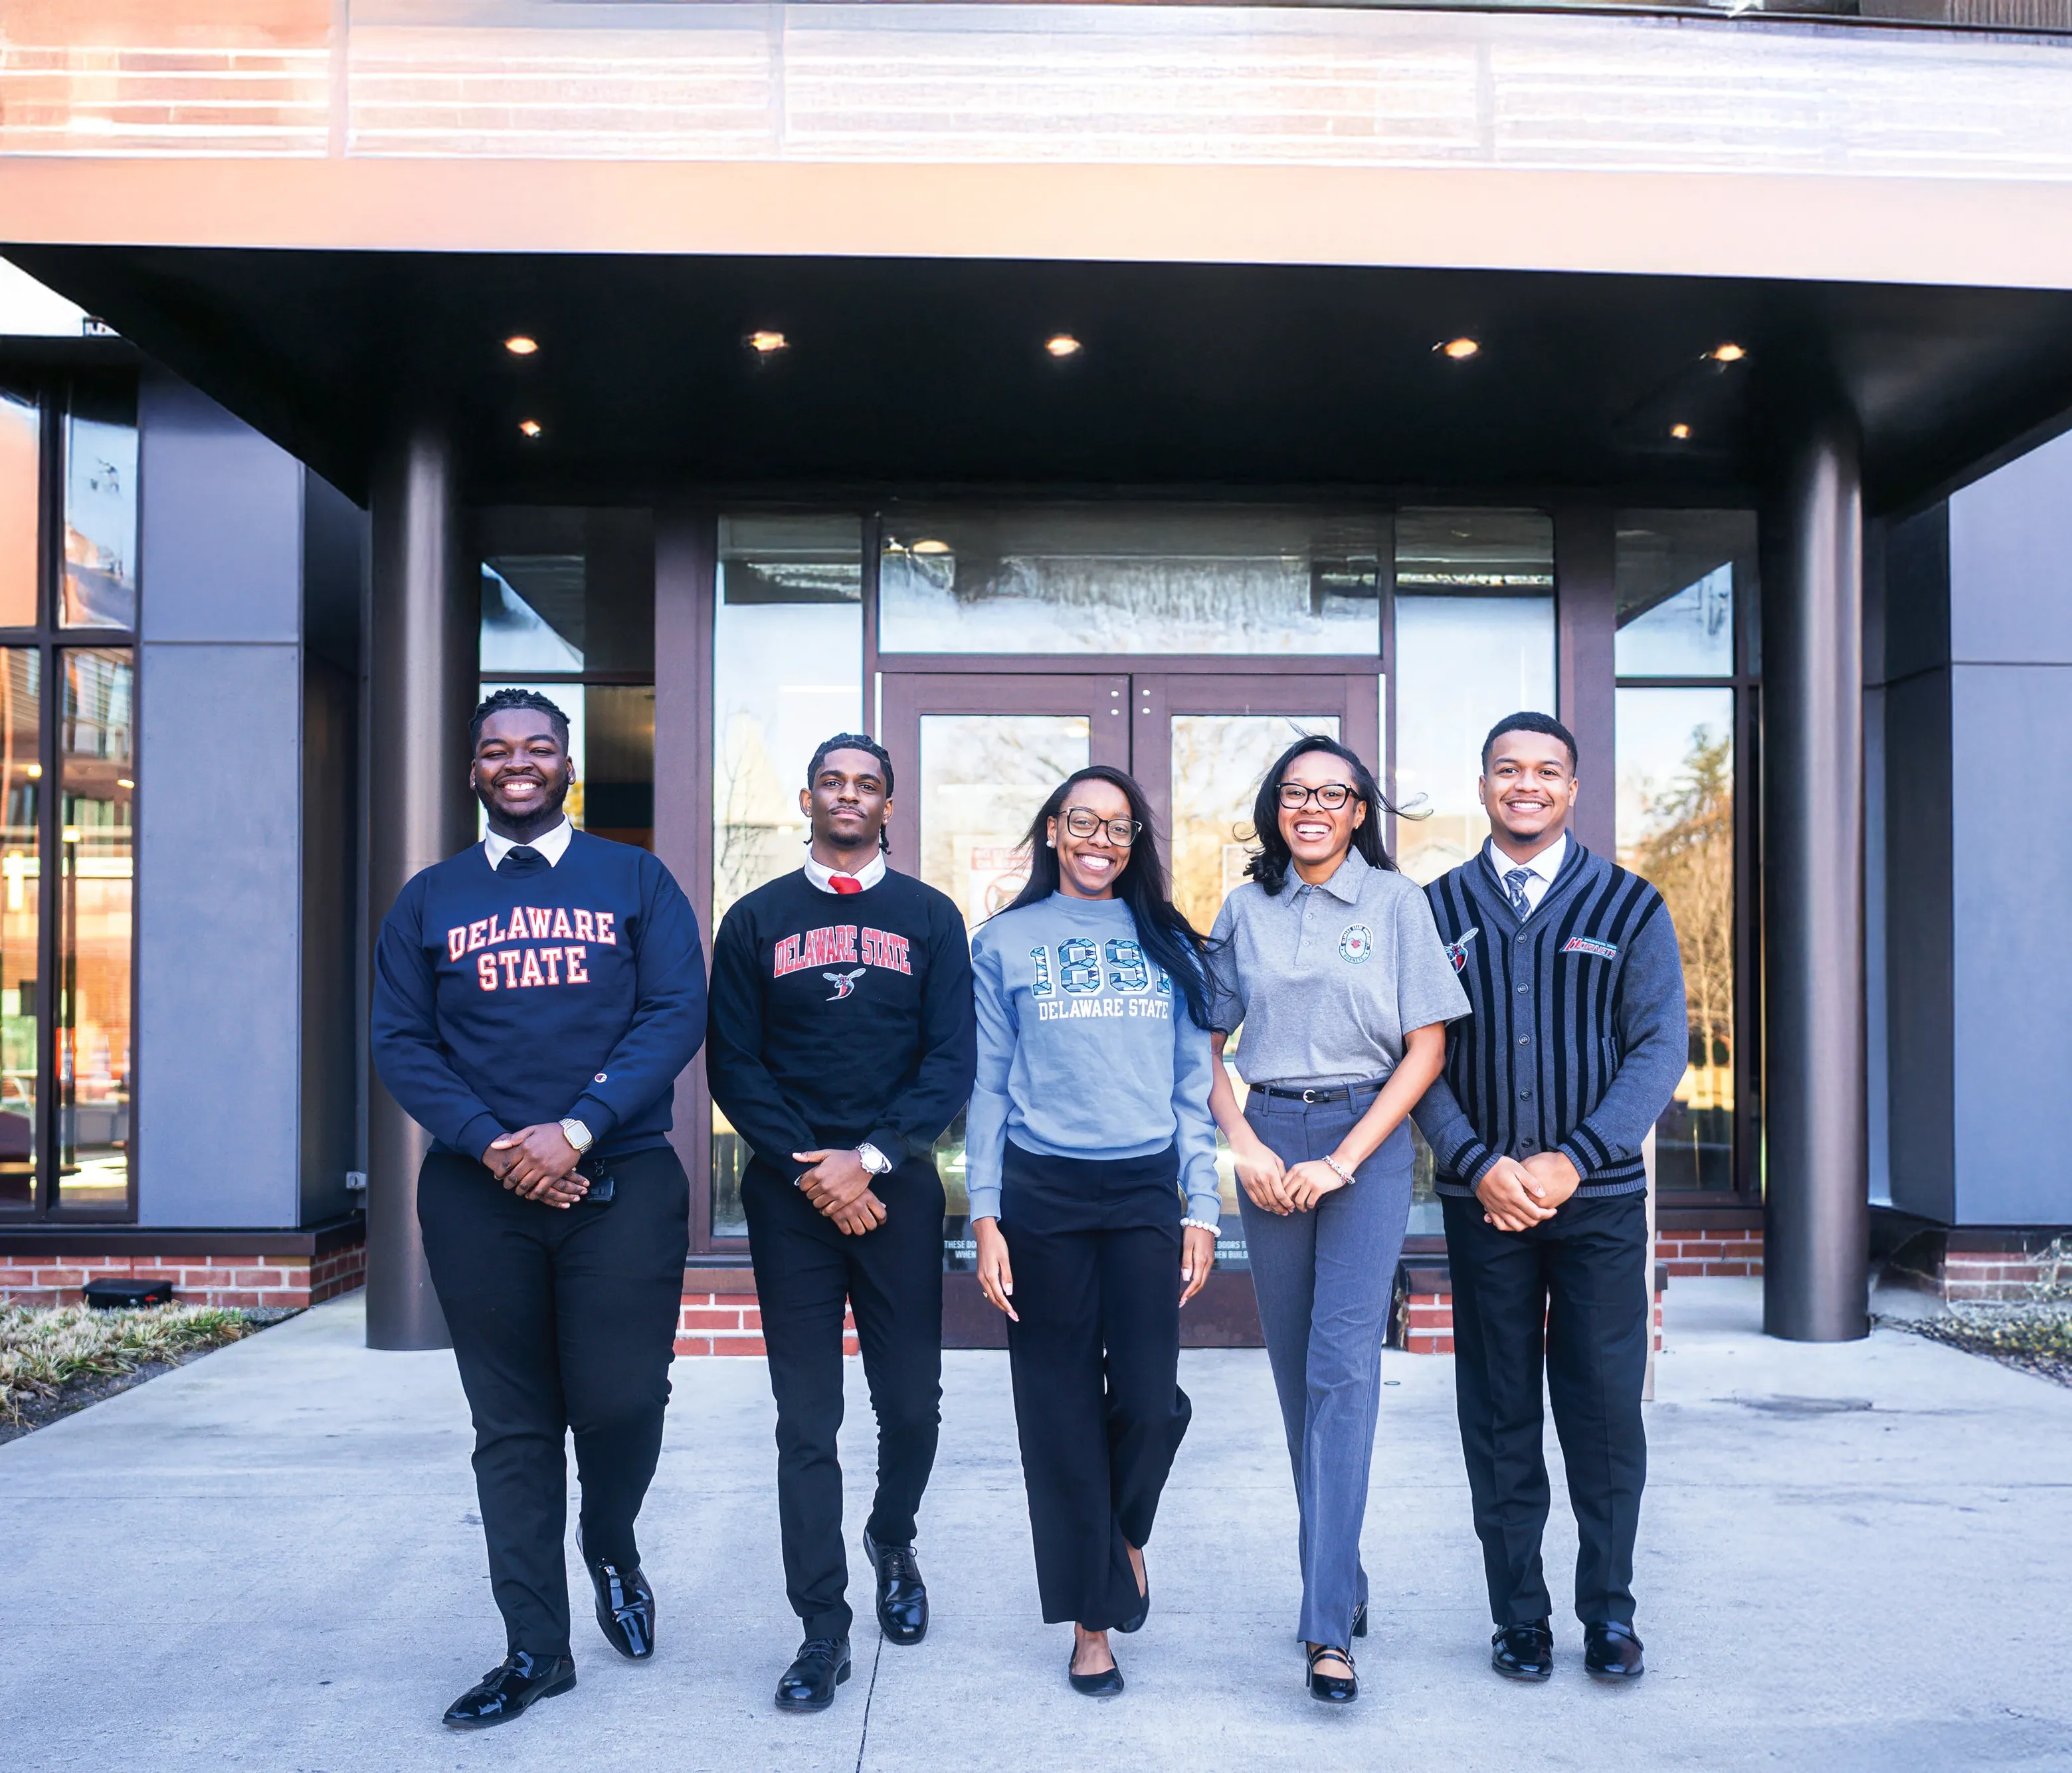
Delaware State University
National Louis University
Northern Illinois University
Rutgers University - Newark
San Francisco State University (launched Fall 2024)
San José State University
Spelman College
University of Massachusetts Lowell (launched Spring 2026)
University of North Texas (launched Spring 2026)
5 Strong Scholars Foundation
Achieve Atlanta
Arkansas Commitment
Ascend Public Schools
Associated Colleges of Illinois
Augustana College
Breakthrough Kent Denver
Carmen Schools of Science & Technology
Chicago Scholars
Chicago State University
City Year Chicago
Coney Island Prep Public Schools
Cooperman College Scholars
Coral Academy of Science Las Vegas
Cristo Rey Network
DREAM Charter School
DSST Public Schools
Evanston Scholars
Excel Academy Charter School
Excellence Community Schools
Freedom Preparatory Academy Charter Schools
IDEA Public Schools
Judson University
KIPP Metro Atlanta
KIPP Forward
KIPP NJ
Lehman College
LISA Academy
National Association for Urban Debate Leagues
Newark Youth Career Pathways Program
North Central College
Noble Schools
Rivet School
SEEDS
The Academy Charter School
The Wight Foundation
Uncommon Schools
Uplift Education
UtmostU
Adobe
Apollo Opportunity Foundation
Barclays
Blackstone Charitable Foundation
Capital One
Deloitte
JPMorgan Chase Foundation
LinkedIn
Morgan Stanley
NBA Foundation
Prudential Foundation
Allstate
Brooks Brothers & The Golden Fleece Foundation
CIBC Foundation
Cognizant US Foundation
The College Board
Salesforce
San Jose Sharks Foundation
Audible
Berkshire Hathaway Specialty Insurance
Blackbaud
CBRE
CME Group Foundation
Cornerstone Research
Nerdwallet
Northern Trust
nvp
Panasonic North America
Pathward N. A.
PwC
Ripple
Silver Lake
Taco Bell Foundation
UBS
United Airlines
Anonymous
Horizon Blue Cross Blue Shield of New Jersey
J&L Companies
M&T Bank
Neuberger Berman
1Huddle
Bain and Company
Brown Advisory
Carvertise
Catalina
Chicago Sky Foundation
Choose New Jersey
Cisco
City Year
Cramer-Krasselt
Devil's Youth Foundation
Enkey.ai
Equal Space
Exelixis
Goodman Theatre
Google
Hacker Dojo
Harris Blitzer Sports & Entertainment
Hispanic Foundation of Silicon Valley
IQVIA
Jacobs Levy Equity Management
Medline
Micron Technology, Inc.
National Black Arts Festival
National Coalition of 100 Black Women
NetApp
NJPAC
Northwestern Medicine
On-Target Supplies and Logistics
Philadelphia 76ers
SAP Americas
San Francisco Chamber of Commerce
Staffmark
Student Leadership Network
Sutter Health
Synchrony
Teach For America
Texas Instruments
The Clorox Company
Unacast
Vanguard
Visa
Wells Fargo
Wu Yee Children's Services
Young Invincibles
Philanthropic Supporters ($10k+)
A Better Chicago Fund, a Fund of the Robert R. McCormick Foundation
Abrams Foundation
Akila Grewal
Allan & Gill Gray Philanthropies
Anonymous (x13)
Arbor Rising
Arrow Impact
Arthur & Toni Rembe Rock
Axim Collaborative
Ballmer Group
Bennett/Raccah Foundation
Blue Meridian Partners
Carnegie Corporation of New York
Carroll and Milton Petrie Foundation
Charles & Helen Schwab Foundation
Charles Ashby Lewis & Penny Bender Sebring
Charles Hayden Foundation
Charter School Growth Fund
Chicago Community Trust
College Futures Foundation
Crankstart Foundation
Crown Family Philanthropies
Cynthia Bowman
David Cohen & Kristen Argo
Deloitte Foundation
Ellie's Foundation Fund
Finnegan Family Foundation
Geraldine R. Dodge Foundation
Give for the Future Fund
Give Forward Foundation
Grace & Steve Voorhis
Gray Foundation
Harriet Watkins
Impact100 Essex
Irene Esteves
Joe & Cheryl Della Rosa
John & Wendy Cozzi
John Greenwood
John Matthew Sobrato & Andie Sobrato
Kasey McJunkin
Ken Ohashi & Adam Freed
Leon & Toby Cooperman Family Foundation
Linda & Brian Sterling
Lindmor Fund
Lisa & Joseph Amato
Longwood Foundation
LuLuMa Foundation
Lynn and Sengal Selassie
MacKenzie Scott
M&T Weiner Foundation
Mansueto Foundation
Marc and Jeanne Malnati Family Foundation
McCance Family Foundation
Michael & Susan Dell Foundation
MR Macgill
New Profit, Inc.
Nicholas Colucci
Origami Works Foundation
Osa Foundation
Paul M. Angell Family Foundation
Paula Sneed & Lawrence Bass
Prosper Road Foundation
Rachel Kohler
René Kern
Ron & Kathy Sonenthal
Sarah Peter
Schreiber Philanthropy
Schultz Family Foundation
Shellye Archambeau
Siegel Family Endowment
Siragusa Family Foundation
Sobrato Family Foundation
Square One Foundation
Steve & Sue Mandel
Strada Education Foundation
Stupski Foundation
Support New Jersey Fund
Susan & Thomas Dunn
Susan Grant
Tammy & Bill Crown
The Berghorst Foundation
The Carson Family Charitable Trust
The Cleveland Avenue Foundation for Education
The Gilliam Foundation
The Ichigo Foundation
The Jeffrey H. and Shari L. Aronson Family Foundation
The Joseph Pedott Charitable Fund at The Chicago Community Foundation
The Laurie M. Tisch Illumination Fund
The Mayer and Morris Kaplan Family Foundation
The MCJ Amelior Foundation
The Mellen Charitable Foundation
Tipping Point Community
Valhalla Foundation
Victoria Foundation
Vivo Foundation
William and Charlene Glikbarg Foundation
Younger Family Fund
Shellye Archambeau
Richard Barth
Phillip L. Clay
John F. Cozzi
Susan Dunn
Irene Esteves
David S. Levy
Shalinee Sharma
Elizabeth Thompson
Harry L. Williams
Charlie Wolfson
A big thank you to our Delaware Board of Directors: Jeff Carper, Mac Macleod, and Tamara Smith.
“Mock interviews and professional feedback helped me confidently articulate my academic background and unique skill set. Overall, the course helped me understand how to align my passion for law and music into a professional brand that is authentic, well-rounded, and career-ready.”

“DSU and Braven strengthened my professional skills through resume building, interview preparation, and practical project-based learning. It expanded my professional network by connecting me with mentors, coaches, and peers who offered guidance and support throughout the experience. Additionally, I gained confidence, clarified my career goals, and better understood how to position my experiences and strengths for future opportunities.”

“Before Braven, I didn’t know what went into having a professional brand. I learned basic interview skills and was able to practice presenting to a panel of judges. DSU and Braven helped me grow immensely through these experiences.”

767 Fellows have completed the Accelerator course since our Spring 2024 launch.

2025 Delaware STATE UNIVERSITY FELLOWS

students from low-income backgrounds10

first-generation college students11

Average course grade
Most Popular majors for
DSU Fellows
SOCIAL SCIENCES
Science, Math & Technology
BUSINESS
HEALTH &
MEDICINE
Engineering
BravenX is a 14-week virtual fellowship experience that equips participants with the skills, networks, confidence, and experience necessary to launch a strong career.


2025 BRAVENX GRADUATES
This program is fully virtual and identical in length, content, and cohort structure as our for-credit university model. However, it is made possible through partnerships with college access and success organizations.
Braven helps empower their college students to build the foundation for their careers. BravenX Fellows earn a financial stipend upon completion of the program in lieu of academic credit. In some cases, BravenX is added as a scholarship requirement.

BravenX graduates secured quality or pathway outcomes 28

BravenX graduates employed overall or enrolled in graduate school


A high quality first job helps individuals build long-term wealth and health. Braven defines a strong first job as one that requires a bachelor’s degree and is full-time, and also includes some combination of promotion pathways, employee benefits, and a market-competitive starting salary.
Six months post-graduation, BravenX Fellows in the class of 2025 are outearning the national average salary for early college graduates.


Recent Braven Graduates NATIONALLY
ARE IN ROLES ALIGNED WITH THEIR LONG-TERM CAREER INTEREST 22
HAVE A JOB WITH EMPLOYER PROVIDED
BENEFITS 22
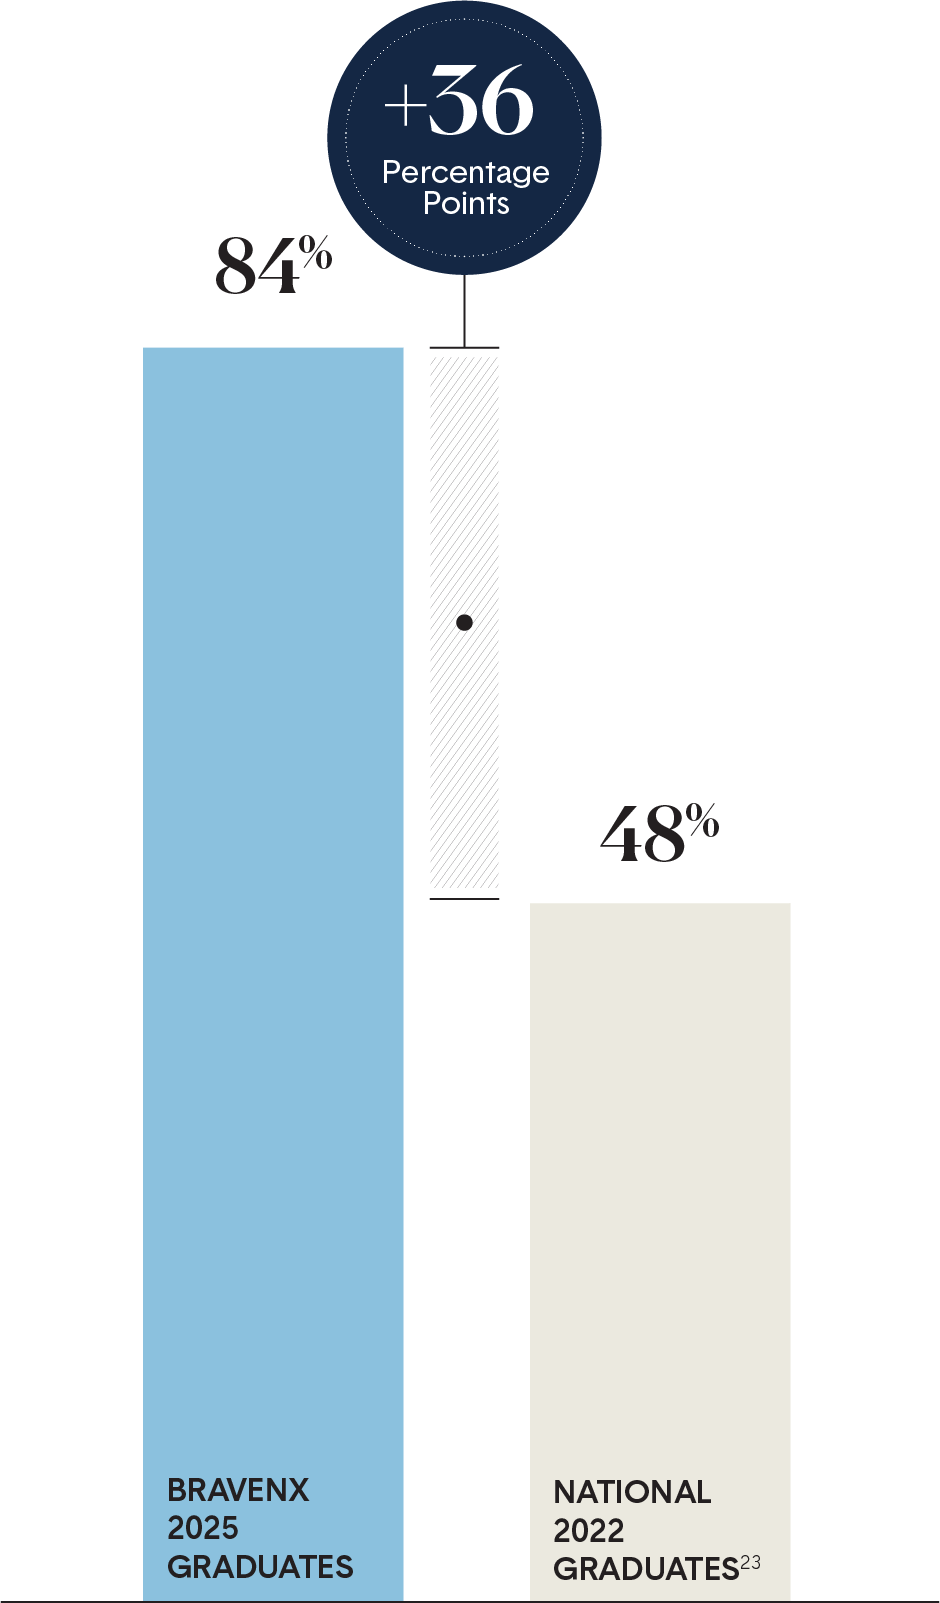
For college students, internships serve as critical proof points of experience that open professional doors.
Compared with graduates nationally, BravenX 2025 graduates were 36 percentage points more likely to have at least one internship during their college experience.


1. 15,563 Fellows have completed the Braven Accelerator course to date; this includes core sites (City College of New York, Delaware State University, Northern Illinois University, Rutgers University-Newark, San Jose State University, and Spelman College) and non-core sites (BravenX, San Francisco State University, Lehman College, and National Louis University).
2. The percentage of students not on the path to the American Dream is an estimate of the percentage of Pell-Grant or first-generation students who have graduated but have not secured a quality job post college. This cohort is based on the latest data available and is the total fall 2022 enrollment of first-time degree/certificate-seeking students in degree-granting postsecondary institutions (NCES 2023 Digest of Education Statistics table 305.10) and the total fall 2021 enrollment of 2YR > 4YR transfers (NSC Research Center Fall 2023 Transfer and Progress Report). Based on this cohort, the percent of students not on path to the American Dream is calculated leveraging the following sources: “Percentage of Undergraduates Receiving Pell Grant in 2022-2023” NCES 2023 IPEDS Trends Generator; “Number of Full-Time, First-Time Degree/Certificate-Seeking Undergraduate Students... by Type of Aid Received” NCES 2020 IPEDS Data Explorer table 20; “Total Undergraduate Fall Enrollment in Degree-Granting Postsecondary Institutions, by Attendance Status, Sex of Student, and Control and Level of Institution: Selected Years, 1970 through 2031” NCES 2023 Digest of Education Statistics table 303.70; Trends in First-Generation Students: College Access, Persistence, and Postbachelor’s Outcomes NCES 2018 First Generation Students Report; Trends in Pell Grant Receipt and the Characteristics of Pell Grant Recipients: Selected Years, 2003–2004, 2015–2016 NCES 2019 IPEDS Trends Generator; NACE 2025 First Destination Survey and September 2025 Federal Reserve Bank of New York Underemployment Rate.
3. “The Labor Market for Recent College Graduates: Unemployment Rates for Recent College Graduates versus Other Groups.” Federal Reserve Bank of New York, 2024, www.newyorkfed.org/research/college-labor-market#--:explore:unemployment. Accessed 24 Feb. 2025.
4. Shrivastava, Allison. “September 2025 Labor Market Update: The Squeeze on New Entrants Mirrors a Marketwide Decline.” Hiring Lab, 25 Sept. 2025, www.hiringlab.org/2025/09/25/september-labor-market-squeeze-on-new-entrants/. Accessed 24 Feb. 2026.
5. Blankenship, Molly, et al. The American Job Quality Study: 2025 State of the U.S. Labor Force. Jobs for the Future / Families and Workers Fund / Gallup, Oct. 2025, www.jff.org/wp-content/uploads/2025/10/AmericanJobQualityReport_Final_10142025.pdf. Accessed 24 Feb. 2026. For the accompanying graph, a quality job is defined as one that allows workers to meet their basic financial needs, feel safe and respected, grow their skills, have a voice in decisions that affect them, and exercise some control over their time and work.
6. Morris, Catherine, et al. The Major Payoff: Evaluating Earnings and Employment Outcomes Across Bachelor’s Degrees. Georgetown University Center on Education and the Workforce, 2025, cew.georgetown.edu/major-payoff. Accessed 24 Feb. 2026.
7. Kessler, Sarah. “The Rise of the Robot Job Seeker.” The New York Times, 21 June 2025, www.nytimes.com/2025/06/21/business/dealbook/ai-job-applications.html. Accessed 24 Feb. 2026.
8. Job Outlook 2025. National Association of Colleges and Employers, Jan. 2025, naceweb.org/docs/default-source/default-document-library/2025/publication/research-report/2025-nace-job-outlook-jan-2025.pdf. Accessed 24 Feb. 2026.
9. 1306 Fellows are from the following core sites: City College of New York, Delaware State University, Northern Illinois University, Rutgers University-Newark, San Jose State University, and Spelman College.
10. Low-income means the Braven Fellow identifies as low-income or a Pell Grant recipient.
11. First-generation means the Braven Fellow identifies as a student who is the first in their immediate family to attend or graduate from a four-year college or university.
12. Braven defines quality outcome attainment using the following methodology:
a. Quality outcome: Fellow enrolls in graduate school or secures a job that requires a BA/BS, is full-time, and is paid.
b. Part-quality outcome: Fellow secures a job that is paid, aligns with long-term career interests, and meets at least one of the criteria below:
i. Requires a bachelor’s degree
ii. Is full-time
iii. Offers employer-provided benefits
iv. Earns >35k per year
v. Builds record of achievement/resume
vi. Builds transferable skills, especially within career interests
c. Not quality: Fellow secures a job that is paid, but does not meet the criteria of a part-quality or quality job.
d. Unemployed: Fellow is unemployed.
13. 57% is the percentage of Fellows who secured a quality job or enrolled in graduate school. All outcome percentages are based on Fellows for which their post-graduation outcome is known (87% or 1136 out of the total 1306 Fellows at core sites’ outcome is known).
14. Braven’s 45% peer benchmark is calculated by taking the NACE 2024 full-time employment rate for students at institutions with a high concentration of Pell Grant recipients (40-60%) from the NACE 2025 First Destination Survey, adjusting it for underemployment (using Federal Reserve of New York and U.S. Census data), and adding the percentage of students pursuing graduate school education.
15. Braven’s 49% national benchmark is calculated by taking the NACE 2024 full-time employment rate from the NACE 2025 First Destination Survey, adjusting it for underemployment (using Federal Reserve of New York and U.S. Census data), and adding the percentage of students pursuing graduate school education.
16. 27% is the percentage of Fellows who enrolled in graduate school. This percentage is based on Fellows for which their post-graduation outcome is known (87% or 1136 out of the total 1306 Fellows at core sites’ outcome is known).
17. Braven employed salary average is the approximated salary average for Class of 2025 Braven Fellows at core sites who secured any job (quality, part-quality, or not quality).
18. Braven full-time employed salary average is the approximated salary average for Class of 2025 Braven Fellows at core sites who secured a quality job.
19. U.S. Census Bureau. American Community Survey. Data filtered by age (AGEP 23-24), income (PINCP>$1), hours worked (WKHP > 35 or WKHP >0), employment status (ESR Civilian employed, at work), and educational attainment (SCHL Bachelor’s degree). U.S. Census Bureau, https://www.census.gov/programs-surveys/acs.
20. Data is based on 380 Post-Accelerator Fellow survey responses pooled from Fall 2021 - Fall 2025 across both core and non-core sites.
21. National Student Aid Profile: Overview of 2024 Federal Programs. National Association of Student Financial Aid Administrators, 2024, https://www.nasfaa.org/uploads/documents/2024_National_Profile.pdf. Accessed 24 Feb. 2026.
22. Handshake Internships Index 2025. Handshake, Mar. 2025, joinhandshake.com/themes/handshake/dist/assets/downloads/network-trends/Handshake-Internships-Index-2025.pdf. Accessed 24 Feb. 2026.
23. Building Better Internships: Evidence from the National Survey of College Internships. Strada Education Foundation / University of Wisconsin-Madison, June 2024, cdn.prod.website-files.com/6777c52f82e5471a3732ea25/679a75b6bb2ab5a398044a74_Building-Better-Internships-Full-Report-Updated-June-2024.pdf. Accessed 24 Feb. 2026.
24. Internship attainment rate is for the following core sites: The City College of New York, Delaware State University, Northern Illinois University, Rutgers University-Newark, San Jose State University, and Spelman College.
25. Clayton, Dave, et al. From College to Career: Students’ Internship Expectations and Experiences. Strada Education Foundation, 17 May 2023, www.strada.org/reports/from-college-to-career-students-internship-expectations-and-experiences. Accessed 24 Feb. 2026.
26. The National Comparison represents the six-year graduation rate for the 2018 cohort of full-time, first-time Pell Grant recipients at four-year public Title IV institutions. This rate is adjusted to account for year-over-year persistence from freshman through junior year. Data is synthesized from the NCES IPEDS Data Explorer (2024), the Digest of Education Statistics (2021), and American Institutes for Research (2023).
27. Six year graduation rate of Braven Fellows includes students who enrolled as first-time freshmen at SJSU and RU-N, not including those who took Braven as seniors, transfers, or international students. SJSU and RU-N are the only core sites included in the six-year graduation rate calculation because they have reached a threshold of graduates to date (200+) for which we have both valid enrollment and graduation data.
28. 51% is the percentage of Fellows who secured a quality job or enrolled in graduate school. All outcome percentages are based on Fellows for which their post-graduation outcome is known (70% or 209 out of the total 298 BravenX Fellows’ outcome is known).