


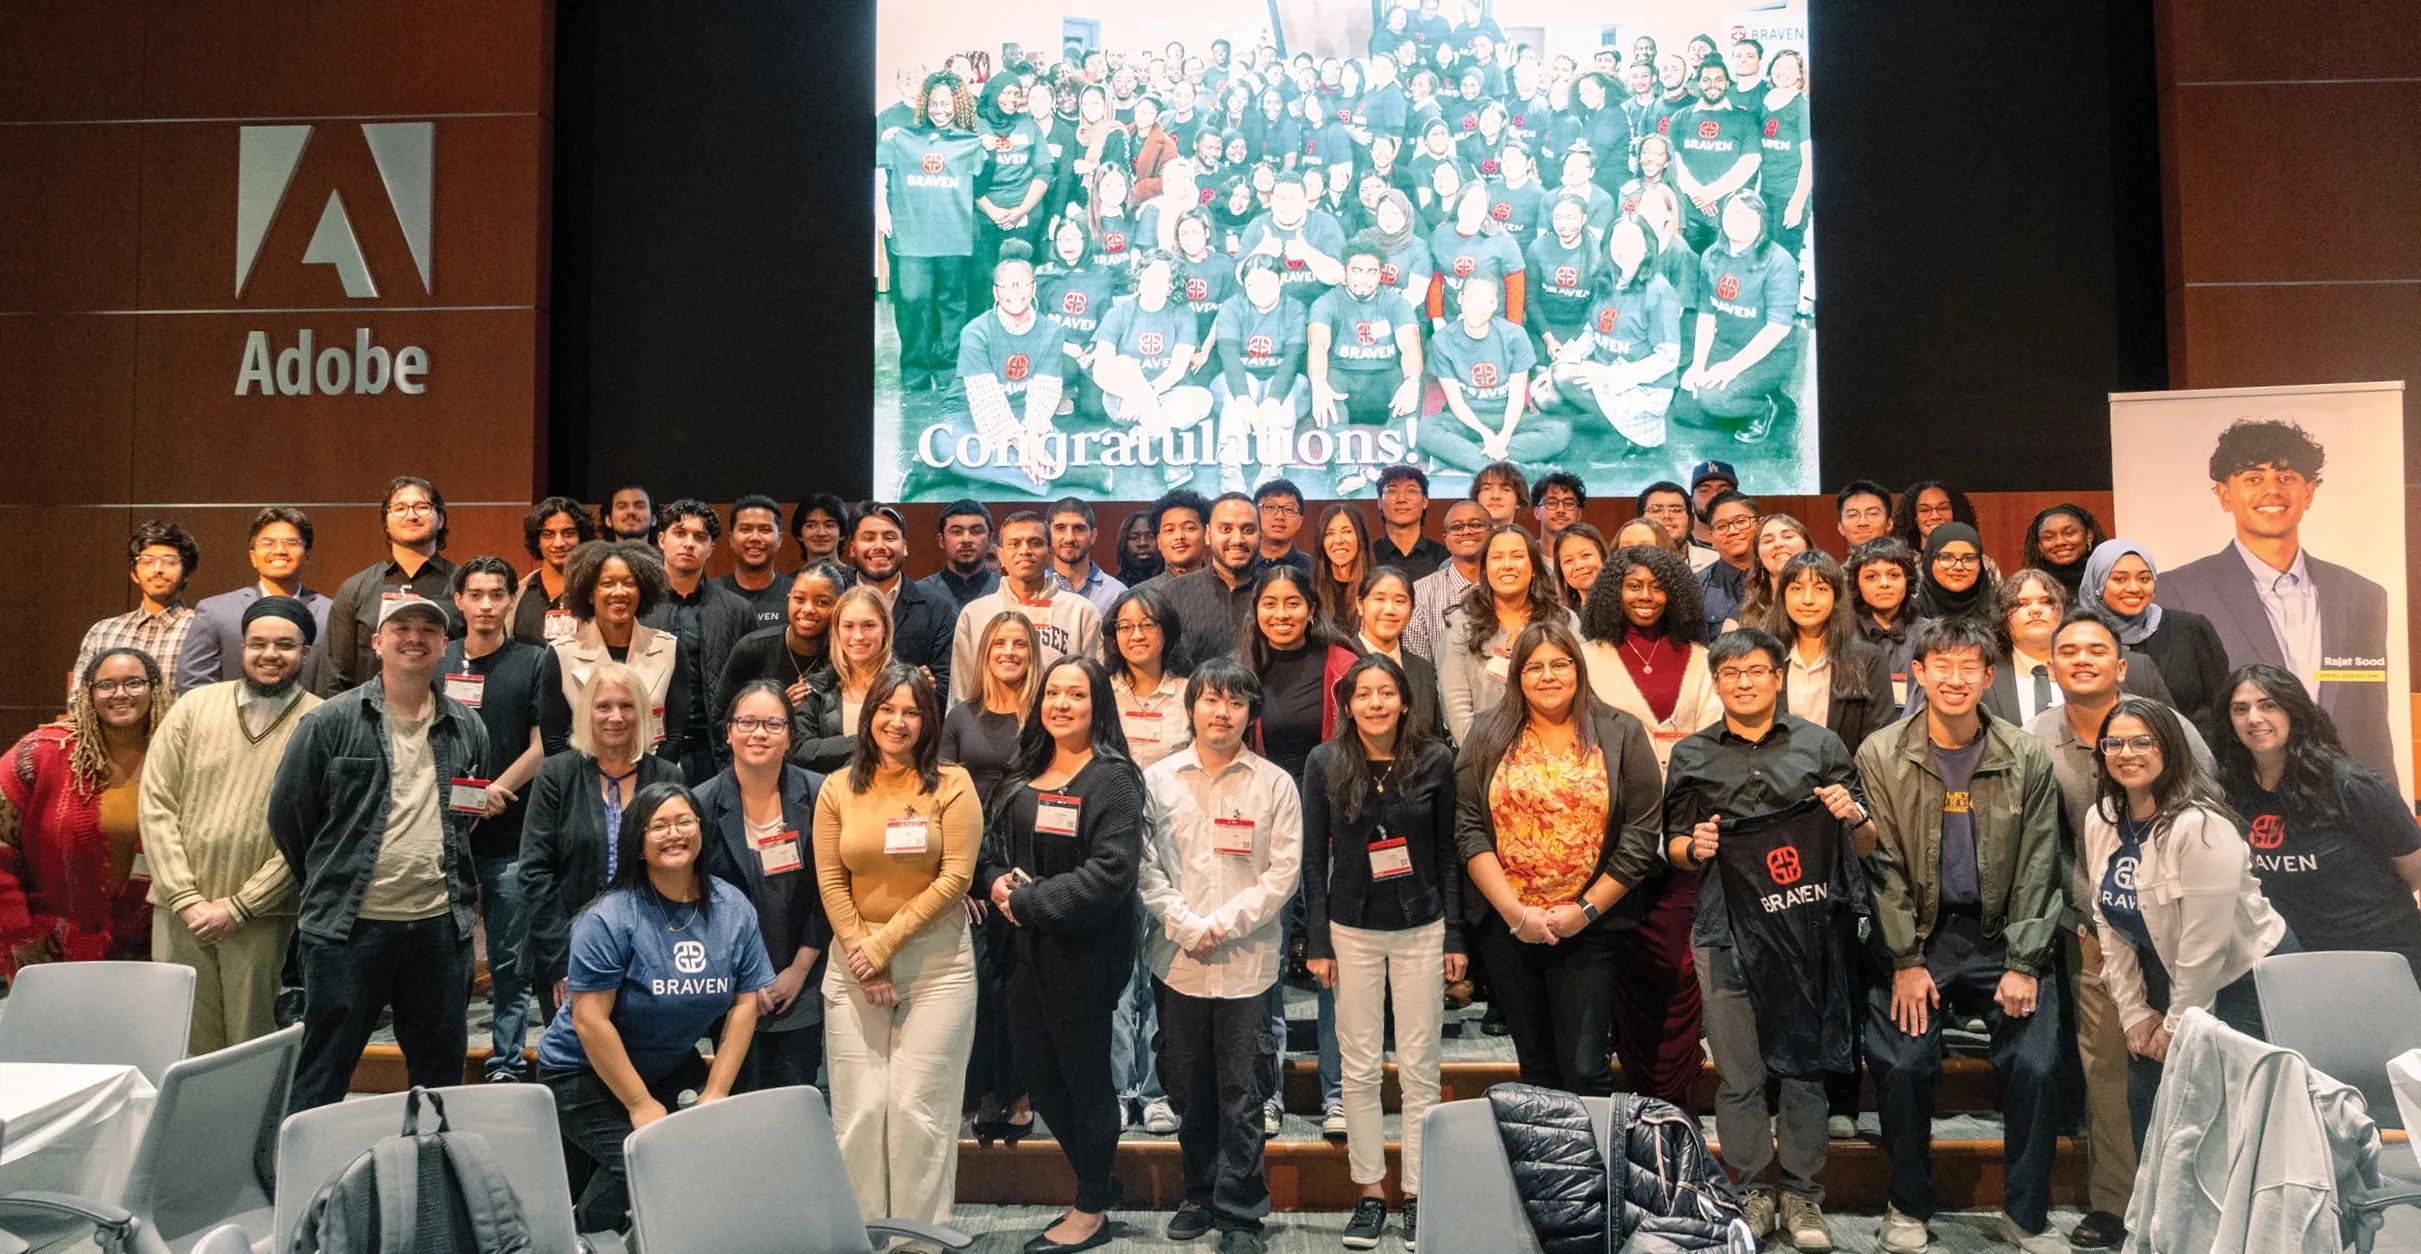
Together with our higher education and employer partners, we’re proving what’s possible when you empower the next generation of leaders with the skills, networks, confidence, and experience necessary to launch a strong career.
To date, we have worked with more than 15,5001 Fellows across the country, and our momentum continues to build. By 2032, we aim to serve 80,000-100,000 students, serving 25,000 new students each year through the Braven course.

In this report, we spotlight the stories of the exceptional undergraduate students we are privileged to serve and examine Braven’s impact through two central questions:
Are our Fellows securing quality career outcomes that put them on the path to the American Dream?
Are we supporting Fellows on the path to internships and college completion?


Only about one quarter of the low-income or first-generation college students who enroll in college each year will graduate and secure a strong first job or enter graduate school.2
That’s about one million students every single year who aren’t on the path to the American Dream.

In collaboration with our higher education and employer partners, Braven empowers promising college students with the skills, networks, confidence, and experience necessary to transition from college to strong economic opportunities, which lead to meaningful careers and lives of impact.
The next generation of leaders will emerge from everywhere.


Braven provides career readiness for students earning a four-year degree, ensuring students graduate ready to secure a strong first opportunity.
The Braven Equation is the sum of four career-readiness factors—skills, networks, confidence, and experience—which add up to a career-ready college graduate.

Braven equips promising college students on their paths toward quality economic opportunities through a semester-long, cohort-based course—developed with input from our higher education partners and faculty, employer partners, volunteers, and students—and support that extends beyond the course, continuing through six months after college graduation.
In our core higher education model, students take the course for credit. Students who come through BravenX via college success organizations receive a financial stipend in lieu of credit.

The entry-level market is tight. We have seen stagnation in entry-level job openings which, in part, is driving rising unemployment of recent graduates.

As AI impacts entry-level jobs, the Bay Area—more dependent on tech than anywhere—is feeling it first and hardest.
Entry-level hiring at the 15 largest tech companies has dropped by over 50% since 2019, with new graduate hires making up 15% of hires before the pandemic compared to just 7% after.6


of employers globally expect to reduce their workforce where AI can automate tasks.7
Of the 112 SJSU Braven Fellows who graduated from college in 2025,
are employed or enrolled in graduate school
secured quality
or pathway outcomes

2025 SJSU BRAVEN GRADUATES
How we define quality economic opportunities:


Fellows who take the Accelerator course as a senior have less time to gain career-accelerating opportunities or participate in mentorship—both highly related to attaining a quality outcome prior to graduating and entering the job market.

SJSU’s Class of 2025 graduates took the Braven Accelerator as a senior
A greater percentage of students who take the course as a sophomore or junior attained a quality outcome compared to those who took the course as a senior.

Enrollment in graduate school is one of the ways Braven defines a quality outcome.
of the 2025 graduates nationwide went on to graduate school within six months of graduation.12


A high quality first job helps individuals build long-term wealth and health. Braven defines a strong first job as one that requires a bachelor’s degree and is full-time, and also includes some combination of promotion pathways, employee benefits, and a market-competitive starting salary.
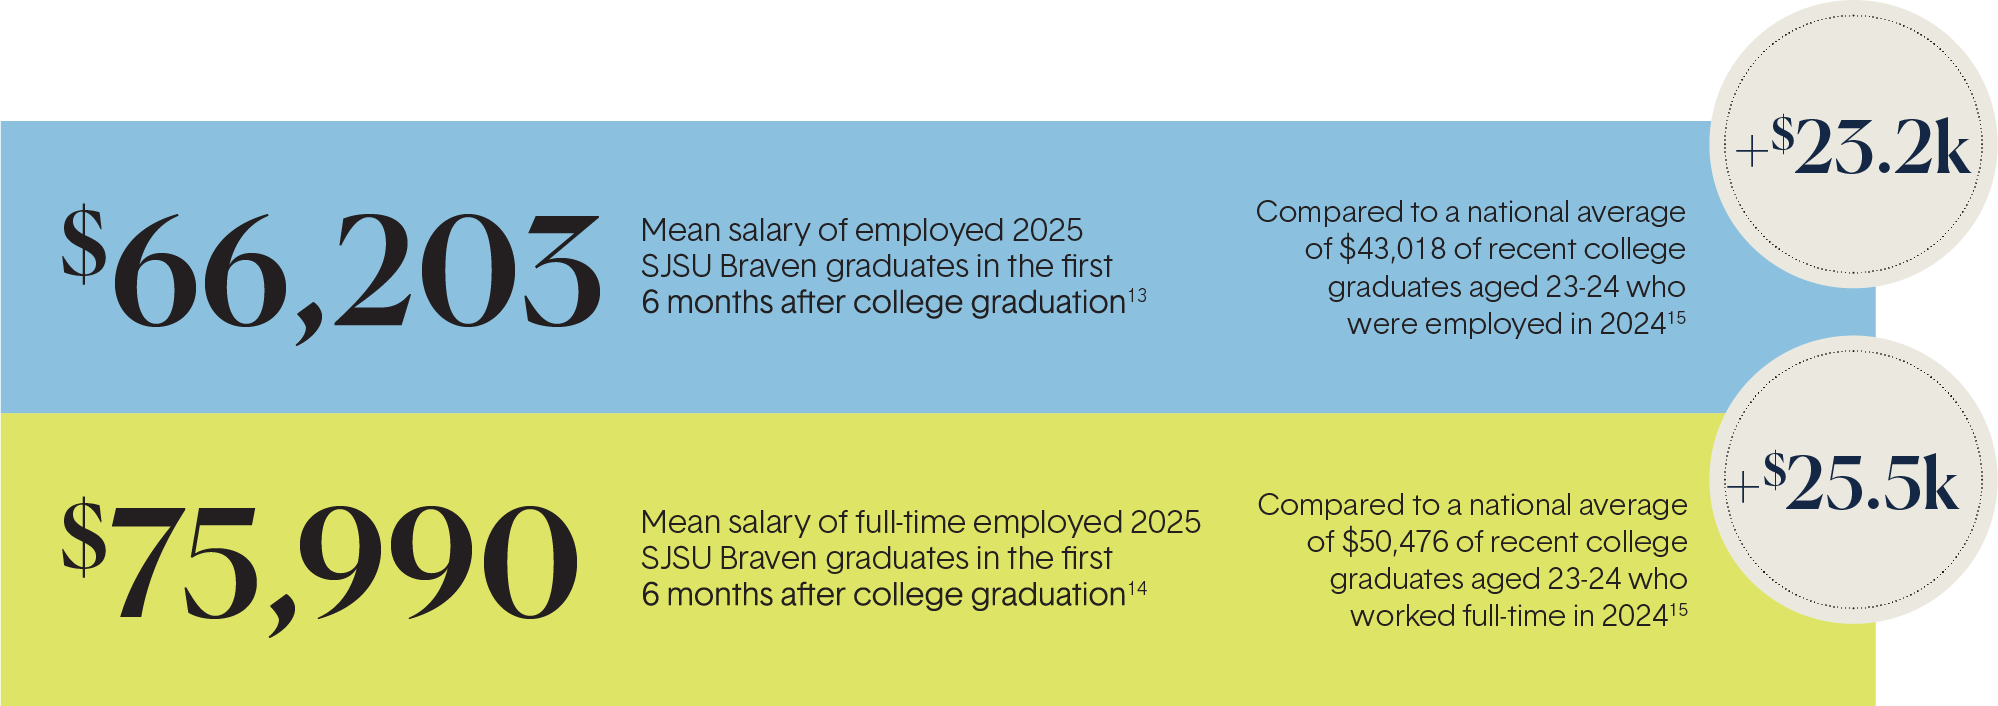
Six months post-graduation, SJSU Braven Fellows in the class of 2025 are outearning the national average salary for early college graduates.

RECENT BRAVEN GRADUATES NATIONALLY

ARE IN ROLES ALIGNED WITH THEIR LONG-TERM CAREER INTEREST 16

HAVE A JOB WITH EMPLOYER PROVIDED
BENEFITS 16
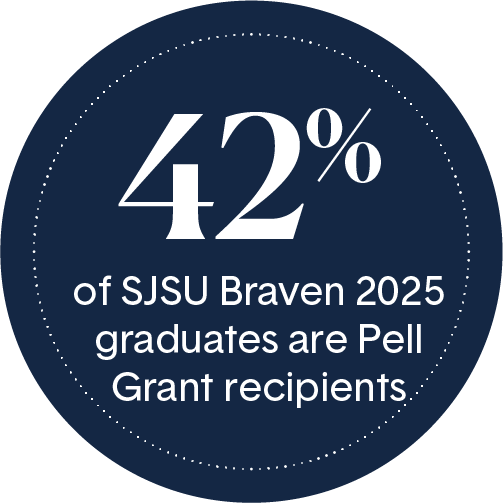
Nationally, 63% of Pell Grant recipients come from families with annual incomes below $30,000, and 85% come from families earning less than $50,000 annually. 17
In their first job out of college, SJSU Braven Fellows are individually outearning most families who receive the Pell Grant.


Most Popular Industries for SJSU Braven Fellows
Health
EDUCATION
Manufacturing
TECHNOLOGY
NONPROFIT
With Braven’s help, Nicholas Gomez built the foundation to get on the path to the American Dream.

Internships help students chart their futures, but fewer opportunities and rising competition make them harder to secure.
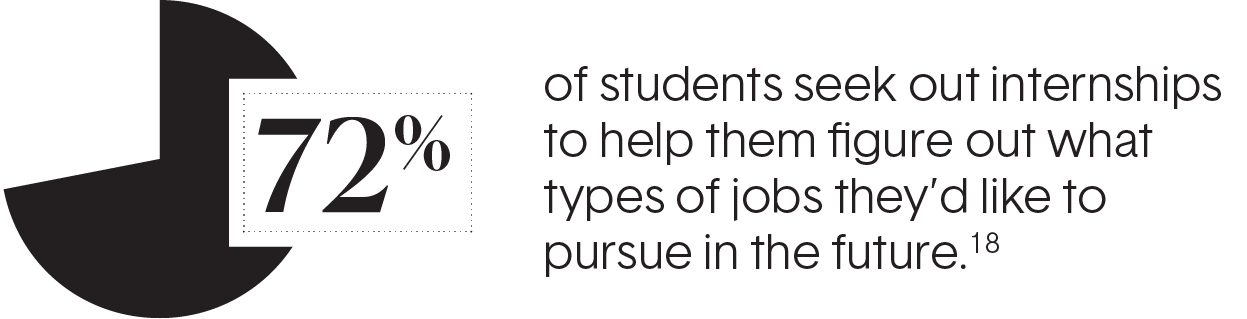
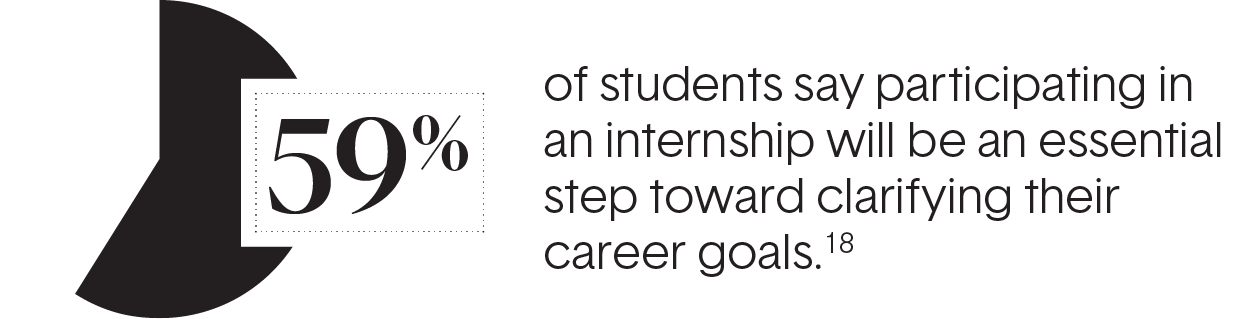
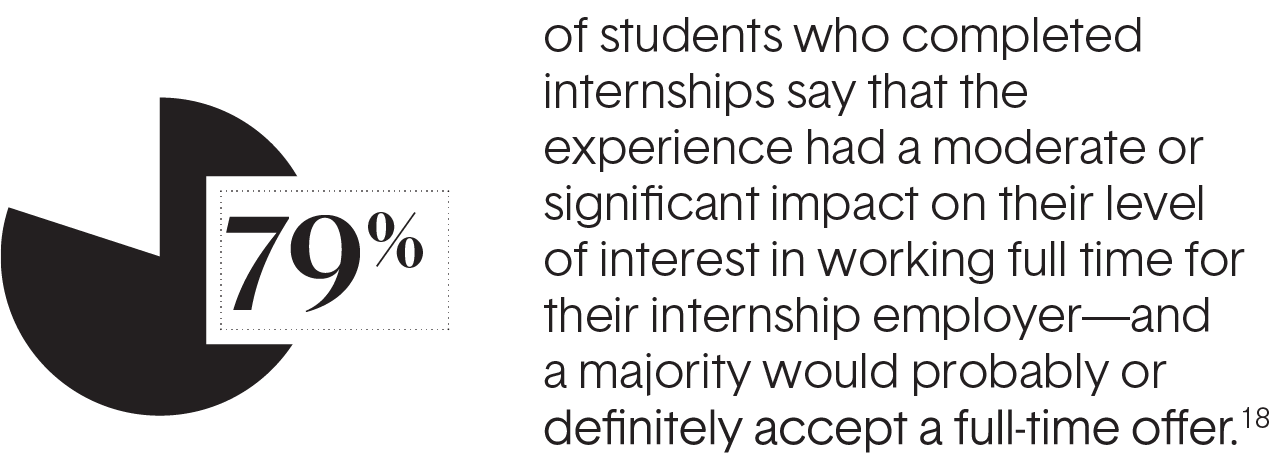
Internship demand is outpacing availability.
Internship postings declined more than 15% between January 2023 and January 2025. Meanwhile, internship applications surged.
The National Survey of Work-Based Learning from Strada Education Foundation and the Center for College Workforce Transitions found that paid internships have positive career value in several domains including social capital and mentorship.
To what extent do you think your experience expanded your professional network?


To what extent did your supervisor provide mentorship to support your career goals?
For college students, internships serve as critical proof points of experience that open professional doors.
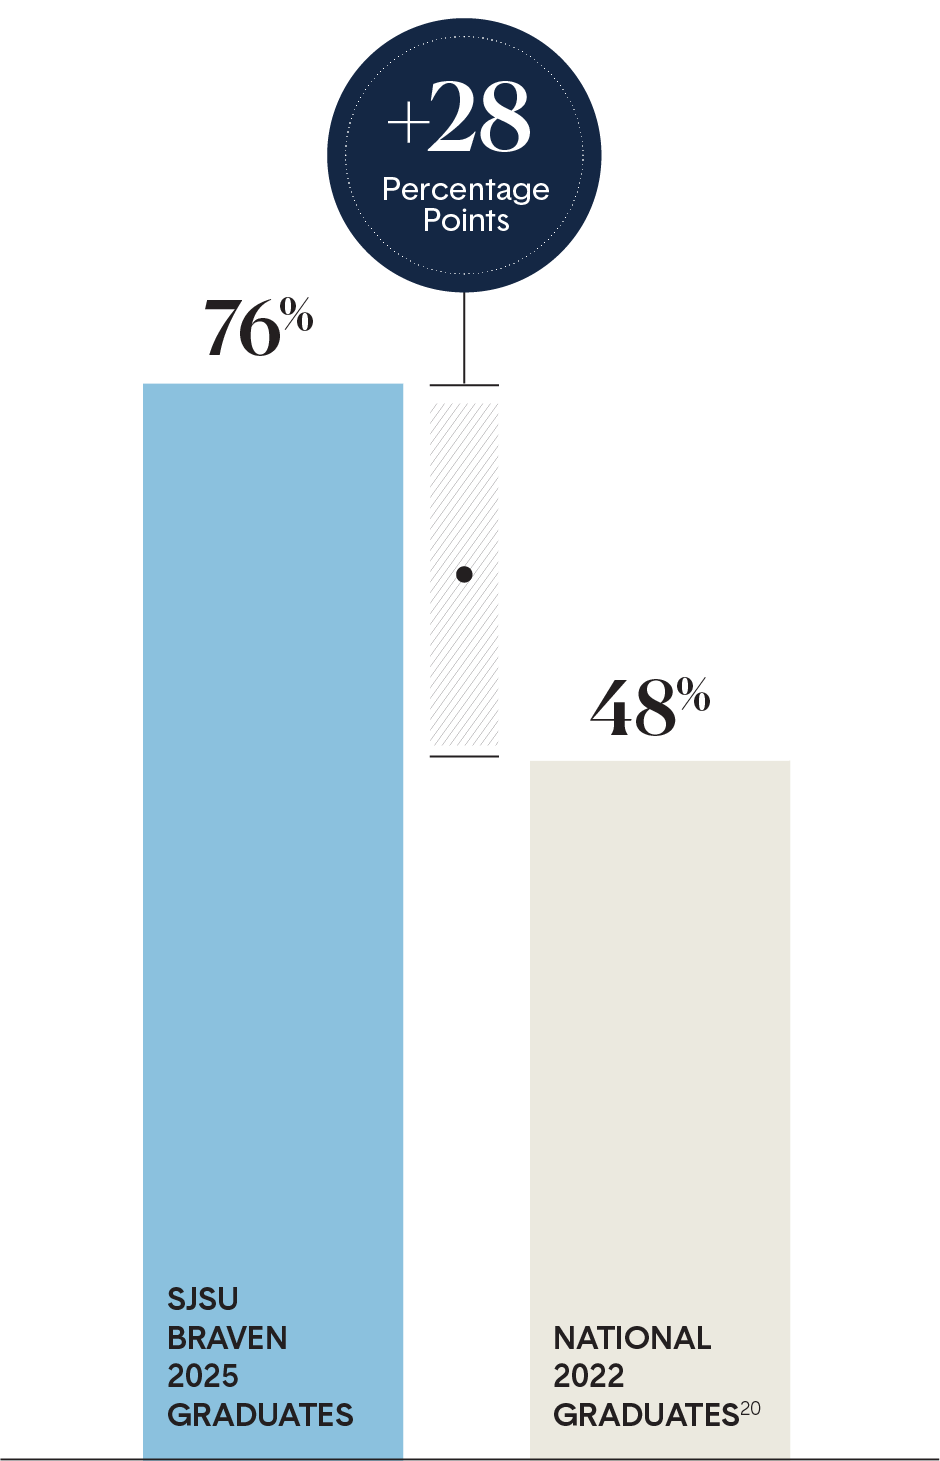
Compared with graduates nationally, SJSU Braven 2025 graduates were 28 percentage points more likely to have at least one internship during their college experience.


Nationally, less than 7 in 10 students graduate within six years of college enrollment.21
Braven Fellows, who typically join us during their sophomore or junior year, are graduating at encouraging rates.
SJSU Braven Fellows
achieved a 93% six-year on-time graduation rate

Higher Education Partners & Employer Partners
Chicago State University (BravenX)
The City College of New York
Delaware State University
National Louis University
Northern Illinois University
Rutgers University - Newark
San Francisco State University (launched Fall 2024)
San José State University
Spelman College
University of Massachusetts Lowell (launched Spring 2026)
University of North Texas (launched Spring 2026)
5 Strong Scholars Foundation
Achieve Atlanta
Arkansas Commitment
Ascend Public Schools
Associated Colleges of Illinois
Augustana College
Breakthrough Kent Denver
Carmen Schools of Science & Technology
Chicago Scholars
Chicago State University
City Year Chicago
Coney Island Prep Public Schools
Cooperman College Scholars
Coral Academy of Science Las Vegas
Cristo Rey Network
DREAM Charter School
DSST Public Schools
Evanston Scholars
Excel Academy Charter School
Excellence Community Schools
Freedom Preparatory Academy Charter Schools
IDEA Public Schools
Judson University
KIPP Metro Atlanta
KIPP Forward
KIPP NJ
Lehman College
LISA Academy
National Association for Urban Debate Leagues
Newark Youth Career Pathways Program
North Central College
Noble Schools
Rivet School
SEEDS
The Academy Charter School
The Wight Foundation
Uncommon Schools
Uplift Education
UtmostU
Adobe
Atlassian
Blackstone Charitable Foundation
Deloitte
JPMorgan Chase Foundation
LinkedIn
Morgan Stanley
NBA Foundation
CIBC Foundation
Cognizant US Foundation
Salesforce
San Jose Sharks Foundation
The College Board
Audible
Berkshire Hathaway Specialty Insurance
Blackbaud
Nerdwallet
Pathward N. A.
PwC
Ripple
Silver Lake
Taco Bell Foundation
UBS
United Airlines
Bain and Company
Brown Advisory
Catalina
Cisco
City Year
Enkey.ai
Exelixis
Google
Hacker Dojo
Hispanic Foundation of Silicon Valley
Micron Technology, Inc.
NetApp
San Francisco Chamber of Commerce
SAP Americas
Sutter Health
Teach For America
Texas Instruments
Unacast
Vanguard
Wu Yee Children's Services
San Francisco Federal Credit Union
Visa
Philanthropic Supporters ($10k+)
Anonymous
Arrow Impact
College Futures Foundation
Crankstart Foundation
Deloitte Foundation
Give Forward Foundation
Grace & Steve Voorhis
John Matthew Sobrato & Andie Sobrato
MR Macgill
Sobrato Family Foundation
Stupski Foundation
Tammy & Bill Crown
Tipping Point Community
William and Charlene Glikbarg Foundation
Younger Family Fund
Abigail “Abby” Smith
Carlos Flores
Charlie Wolfson
Jessica García-Kohl
Muna Sheikh
Sunita Suryanarayan
1. 15,563 Fellows have completed the Braven Accelerator course to date; this includes core sites (City College of New York, Delaware State University, Northern Illinois University, Rutgers University-Newark, San Jose State University, and Spelman College) and non-core sites (BravenX, San Francisco State University, Lehman College, and National Louis University).
2. The percentage of students not on the path to the American Dream is an estimate of the percentage of Pell-Grant or first-generation students who have graduated but have not secured a quality job post college. This cohort is based on the latest data available and is the total fall 2022 enrollment of first-time degree/certificate-seeking students in degree-granting postsecondary institutions (NCES 2023 Digest of Education Statistics table 305.10) and the total fall 2021 enrollment of 2YR > 4YR transfers (NSC Research Center Fall 2023 Transfer and Progress Report). Based on this cohort, the percent of students not on path to the American Dream is calculated leveraging the following sources: “Percentage of Undergraduates Receiving Pell Grant in 2022-2023” NCES 2023 IPEDS Trends Generator; “Number of Full-Time, First-Time Degree/Certificate-Seeking Undergraduate Students... by Type of Aid Received” NCES 2020 IPEDS Data Explorer table 20; “Total Undergraduate Fall Enrollment in Degree-Granting Postsecondary Institutions, by Attendance Status, Sex of Student, and Control and Level of Institution: Selected Years, 1970 through 2031” NCES 2023 Digest of Education Statistics table 303.70; Trends in First-Generation Students: College Access, Persistence, and Postbachelor’s Outcomes NCES 2018 First Generation Students Report; Trends in Pell Grant Receipt and the Characteristics of Pell Grant Recipients: Selected Years, 2003–2004, 2015–2016 NCES 2019 IPEDS Trends Generator; NACE 2025 First Destination Survey and September 2025 Federal Reserve Bank of New York Underemployment Rate.
3. “The Labor Market for Recent College Graduates: Unemployment Rates for Recent College Graduates versus Other Groups.” Federal Reserve Bank of New York, 2024, www.newyorkfed.org/research/college-labor-market#--:explore:unemployment. Accessed 24 Feb. 2025.
4. Shrivastava, Allison. “September 2025 Labor Market Update: The Squeeze on New Entrants Mirrors a Marketwide Decline.” Hiring Lab, 25 Sept. 2025, www.hiringlab.org/2025/09/25/september-labor-market-squeeze-on-new-entrants/. Accessed 24 Feb. 2026.
5. Blankenship, Molly, et al. The American Job Quality Study: 2025 State of the U.S. Labor Force. Jobs for the Future / Families and Workers Fund / Gallup, Oct. 2025, www.jff.org/wp-content/uploads/2025/10/AmericanJobQualityReport_Final_10142025.pdf. Accessed 24 Feb. 2026. For the accompanying graph, a quality job is defined as one that allows workers to meet their basic financial needs, feel safe and respected, grow their skills, have a voice in decisions that affect them, and exercise some control over their time and work.
6. Morris, Catherine, et al. The Major Payoff: Evaluating Earnings and Employment Outcomes Across Bachelor’s Degrees. Georgetown University Center on Education and the Workforce, 2025, cew.georgetown.edu/major-payoff. Accessed 24 Feb. 2026.
7. Kessler, Sarah. “The Rise of the Robot Job Seeker.” The New York Times, 21 June 2025, www.nytimes.com/2025/06/21/business/dealbook/ai-job-applications.html. Accessed 24 Feb. 2026.
8. Job Outlook 2025. National Association of Colleges and Employers, Jan. 2025, naceweb.org/docs/default-source/default-document-library/2025/publication/research-report/2025-nace-job-outlook-jan-2025.pdf. Accessed 24 Feb. 2026.
9. 1306 Fellows are from the following core sites: City College of New York, Delaware State University, Northern Illinois University, Rutgers University-Newark, San Jose State University, and Spelman College.
10. Low-income means the Braven Fellow identifies as low-income or a Pell Grant recipient.
11. First-generation means the Braven Fellow identifies as a student who is the first in their immediate family to attend or graduate from a four-year college or university.
12. Braven defines quality outcome attainment using the following methodology:
a. Quality outcome: Fellow enrolls in graduate school or secures a job that requires a BA/BS, is full-time, and is paid.
b. Part-quality outcome: Fellow secures a job that is paid, aligns with long-term career interests, and meets at least one of the criteria below:
i. Requires a bachelor’s degree
ii. Is full-time
iii. Offers employer-provided benefits
iv. Earns >35k per year
v. Builds record of achievement/resume
vi. Builds transferable skills, especially within career interests
c. Not quality: Fellow secures a job that is paid, but does not meet the criteria of a part-quality or quality job.
d. Unemployed: Fellow is unemployed.
13. 57% is the percentage of Fellows who secured a quality job or enrolled in graduate school. All outcome percentages are based on Fellows for which their post-graduation outcome is known (87% or 1136 out of the total 1306 Fellows at core sites’ outcome is known).
14. Braven’s 45% peer benchmark is calculated by taking the NACE 2024 full-time employment rate for students at institutions with a high concentration of Pell Grant recipients (40-60%) from the NACE 2025 First Destination Survey, adjusting it for underemployment (using Federal Reserve of New York and U.S. Census data), and adding the percentage of students pursuing graduate school education.
15. Braven’s 49% national benchmark is calculated by taking the NACE 2024 full-time employment rate from the NACE 2025 First Destination Survey, adjusting it for underemployment (using Federal Reserve of New York and U.S. Census data), and adding the percentage of students pursuing graduate school education.
16. 27% is the percentage of Fellows who enrolled in graduate school. This percentage is based on Fellows for which their post-graduation outcome is known (87% or 1136 out of the total 1306 Fellows at core sites’ outcome is known).
17. Braven employed salary average is the approximated salary average for Class of 2025 Braven Fellows at core sites who secured any job (quality, part-quality, or not quality).
18. Braven full-time employed salary average is the approximated salary average for Class of 2025 Braven Fellows at core sites who secured a quality job.
19. U.S. Census Bureau. American Community Survey. Data filtered by age (AGEP 23-24), income (PINCP>$1), hours worked (WKHP > 35 or WKHP >0), employment status (ESR Civilian employed, at work), and educational attainment (SCHL Bachelor’s degree). U.S. Census Bureau, https://www.census.gov/programs-surveys/acs.
20. Data is based on 380 Post-Accelerator Fellow survey responses pooled from Fall 2021 - Fall 2025 across both core and non-core sites.
21. National Student Aid Profile: Overview of 2024 Federal Programs. National Association of Student Financial Aid Administrators, 2024, https://www.nasfaa.org/uploads/documents/2024_National_Profile.pdf. Accessed 24 Feb. 2026.
22. Handshake Internships Index 2025. Handshake, Mar. 2025, joinhandshake.com/themes/handshake/dist/assets/downloads/network-trends/Handshake-Internships-Index-2025.pdf. Accessed 24 Feb. 2026.
23. Building Better Internships: Evidence from the National Survey of College Internships. Strada Education Foundation / University of Wisconsin-Madison, June 2024, cdn.prod.website-files.com/6777c52f82e5471a3732ea25/679a75b6bb2ab5a398044a74_Building-Better-Internships-Full-Report-Updated-June-2024.pdf. Accessed 24 Feb. 2026.
24. Internship attainment rate is for the following core sites: The City College of New York, Delaware State University, Northern Illinois University, Rutgers University-Newark, San Jose State University, and Spelman College.
25. Clayton, Dave, et al. From College to Career: Students’ Internship Expectations and Experiences. Strada Education Foundation, 17 May 2023, www.strada.org/reports/from-college-to-career-students-internship-expectations-and-experiences. Accessed 24 Feb. 2026.
26. The National Comparison represents the six-year graduation rate for the 2018 cohort of full-time, first-time Pell Grant recipients at four-year public Title IV institutions. This rate is adjusted to account for year-over-year persistence from freshman through junior year. Data is synthesized from the NCES IPEDS Data Explorer (2024), the Digest of Education Statistics (2021), and American Institutes for Research (2023).
27. Six year graduation rate of Braven Fellows includes students who enrolled as first-time freshmen at SJSU and RU-N, not including those who took Braven as seniors, transfers, or international students. SJSU and RU-N are the only core sites included in the six-year graduation rate calculation because they have reached a threshold of graduates to date (200+) for which we have both valid enrollment and graduation data.
28. 51% is the percentage of Fellows who secured a quality job or enrolled in graduate school. All outcome percentages are based on Fellows for which their post-graduation outcome is known (70% or 209 out of the total 298 BravenX Fellows’ outcome is known).